Trotting debugger
2022-04-11

There are many excuses not to use the new functional syntax of ABAP 7.4. One is complaining that it’s impossible to debug.
But it is not.

There are many excuses not to use the new functional syntax of ABAP 7.4. One is complaining that it’s impossible to debug.
But it is not.
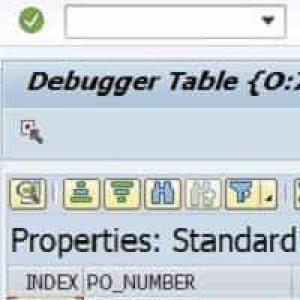
I don’t know for how long has this been available but I just now found out about it. In the debugger it is, after all, super easy to see the content of an internal table in an ALV.

Some time ago we spoke about SAAB and its advantages as a tool to analyse, debug and find problems in our code. In that article we didn’t explore an important aspect of it: Activation variants.

In a well protected system, normal users don’t have debug permissions. Very often, this makes it harder for ABAP programmers to help solve the users’ problems, not being able to debug directly in their session.
But there is a legit, albeit obscure, work-around for this problem.

Although a substantial part of an ABAP programmer time is spent debugging code, most programmers I know don’t invest much in getting to know the ABAP debugger. Maybe because they spent too many years working with its previous version which was truly archaic and worthless. But the new one can do much more than you usually ask of it. And Abapinho intends to teach you how.
Today I’ll teach you just a simple key.

When you debug you use F5 key to move to the next statement (or go inside a sub-routine). But imagine an IF with multiple conditions:
IF A = 1 AND B = 2 AND C = 3.
  WRITE 'I like the word glauc'.
ENDIF.
When you debug through that IF using F5 and one of the expressions is false you’ll step out of the IF without knowing which of the three was false.
But the new debugger has a new very neat functionality which can help you to better understand what happened there.

Checkpoints is a very powerful ABAP framework which almost nobody uses. Why? Probably for the same reason hardly anyone listens to Sun Ra and knows that Frank Zappa has 102 albums. Because, even though really good, it’s obscure and not commercial. Checkpoints are, indeed, really good and not commercial. But they should be more like Mozart and the Beach Boys which are both good and commercial.

Today we have a guest, Tamás Holics. He owns STA Consulting, a Hungarian company which has created 2 very interesting SAP products. In this article Tamás presents the STA Ticket System.
A lot of time is wasted in SAP software testing and maintenance processes due to incomplete or incorrect error reports from users and testers. Support people (analysts, developers) usually have to ask for more information about the error. This takes a lot of valuable working time from both the reporters of the error and support people. Solving the problem is often blocked until every information is available.

Imagine you have a program executing an infinite cycle or, at least, a cycle with 70x7 iterations. It is neverending, and you want to know what’s going on there.
In the past you had to go to SM50, select the process and choose from the menu “Administration | Program | Debug”.
But now there is a much easier way.

If you look up the UNAME system variable in debug within a RFC call you may think it kind of odd to find a username that is not your own. What happens is that the system adopts a specific username for remote calls and a new session is started. A new session implies a new execution context and, hence, all our strategically placed breakpoints will no longer be recognised.
This problem can hinder a simple debug forcing us to run through the code looking for THAT remote call to THAT particular system.
SAP has a solution.

Here’s a simple way to start debugging a job: Go to transaction SM37; Click on the job you want to debug; type JDBG in the command line (without /) and press ENTER; and… bang! you’re now debugging the job. Thank you Ricardo Monteiro for the tip. And thank you Ingolf for the photo. Greetings from Abapinho

Some months ago I showed how to transform the debugger into a time machine. Today’s tip is simple but useful: there is a keyboard shortcut which makes it even simple to travel in time: shift + F12 Just place the cursor in the line you want to travel to and then… shift+F12. Thank you Maxsuel Maia for the tip. Greetings from Abapinho.